The documentation on this interesting recent optical tests appeared on the Internet in the different languages of the countries where it is more widespread self-amateur optical construction. So a text in Italian, there is currently not existing. therefore, being I curious and “insider” I thought to translate into Italian, for my use and for people like me who can benefit, in the following article-, the original of which is located at the following address: http://www.astrosurf.com/tests/roddier/roddier.htm
The advantage of this test is that it is of photometric type, and then provides information about the status of the optical surface of the WHOLE mirror. BUT this information is not the result of subjective evaluations by executing the test, as with almost all optical tests applicable amateur, but are the result of an objective assessment performed by the computer based on the analysis developed on the two photographic image of a shooting star in intra and extra focal length of the instrument.
The very fact, however, that this interesting test is based on two camera shots inside and outside of a telescope focal, It assumes that the telescope is an already constructed and operative tool.
Which relegates the use of the test interest in a mere qualitative assessment of an existing optical, rendering it useless to manufacturer “grattavetro” that always yearns to find a non subjective test method, in alternative at the subjectivity inherent more or less all useful optical tests method aplyables in course of mirror parabolization, Tests that are aimed at providing a quantitative errors guide, to the corrections to be made in the various tweaks that follow the path of the manufacture of one “best mirror”, or ...(why not) a “perfect mirror”.
This is a test “byproduct from” of the technology”adaptive optics”, developed, (and for quite some time “classified” with military interest) for locally and temporarily deform the optical properties of very large telescopes in order to instantly compensate for the damage caused by atmospheric turbulence, virtually eliminating the latter in real time, as it occurs in the course of observation.
Such adaptive optics provides for the transformation of the captured image from the telescope into a mathematical algorithm that identifies the presence of a certain local optical aberration, and it corrects it with mechanical actuators which generate an opposite sign.
The study of optical aberrations, and their description in mathematical terms greatly facilitated by computing, It means that the same principle can be applied in this RODDIER test for the evaluation of the optics also at amateur level, with an interesting precision and completeness.
Here is the article:
(Claude and her husband François Roddier worked at the observatory in Hawaii, specifically on the high angular resolution. They are now retired. Their works on optics and adaptive active were a contribution to improving the performance of very large telescopes. )
1. theoretical Principle
2. An example to better understand
3. A practical example
As known, with visual test type the star test, you can get information on the optical defects of an instrument, observing the two blurred images of a star. The test Roddier generalizes this concept with a computer program realizing a photometric and geometric analysis automatic two photographs executed in intra and extrafocal, obtained with a CCD camera.
• The computer program is available for free on the Web
• See the progress of the project to link the original article reported above, and download the program WinRoddier.
1. theoretical Principle
To begin with we consider a perfect tool, it provides to its focus the image of a star. They then recorded two defocalizzate images; one o'clock at the distance "l" forward , over the fire (towards the inside of the instrument); and once in the same "l" but distance back before the fire (towards the outside of the instrument)
The entrance pupil is illuminated in a uniform manner (I0 intensity ), and just a small portion of this pupil (fig.1): The luminous flux passing through this small portion intrafocale illuminates the image on a smaller surface, with an intensity I1, and extrafocal image on a surface I2 equal to that of the image intrafocale, since the two images are taken at the same distance from the fire. The initial intensity I0 is therefore "concentrated" in the same way on the two images, and you have:
I1 = I2
Suppose now that the front of the outgoing wave from the entrance pupil has a flaw: On the surface of small pupil considered previously, it appears curved (fig.2) .The real fire is, for this portion of the pupil, located in front of the fire the instrument. On the image thus intrafocale, the light is more concentrated than on the extrafocal.
I1 > I2
Col di Roddier test is now compares I1 to I2 thanks to the calculation of the quantity I2 - I1, in order to go back to the defects in the wavefront.

Fig. 2 : Test Roddier of a faulty instrument: The I1et intensity I2 are different. This intensity difference is related to the curvature of the wavefront.
The theory shows that if one considers the image as a whole (and not small portions as above), the signal calculated by performing the subtraction of the two intra and extra images, It is proportional to the Laplacian of the wavefront.
• The Laplacian wavefront (the calculation of which implies the second derivative), It is related to the curvature of the wavefront (see Figure 2)
NOTE: (the mathematical Laplace operator or Laplacian, whose name is due to Pierre Simon Laplace, is a second order differential operator defined as the divergence of the gradient of a function in a Euclidean space).
The problem in our case is different: We have to rebuild the wavefront from its Laplacian. This is done with the help of a specialized computer program that, makes, in addition to the calculation of the Laplacian, numerous geometric and photometric corrections aimed at determining the wavefront aberrations.
These calculations are often performed in real time by professionals (Active in modern optical systems, or adaptive) running the test Roddier to deform the optical surface of the large mirrors in order to correct the aberrations of the wavefront.
2. An example to better understand
The figure 3 It represents the region of fire of a dented tool from spherical aberration (in overcorrection) : The central rays converge with a shorter focal length than that of the marginal rays. The wavefront aberration corresponding to this is translated into levels of gray (fig. 4A): The wavefront is concave in the middle, and retorted at the edge. The image of Figure 4B represents the Laplacian of this wavefront.

Fig. 3 : Fire region of a tool presenting a spherical aberration (over-correction). The target board has a longer focal length than that of its center. keywords + e – refer to the luminous intensity differences on intra and extra images, in relation to an intensity distributed uniformly in the absence of aberration (the case of Figure 1).

Fig.4A: Wavefront – Figura 4B: Laplacian wavefront – Fig.5 A. Picture intrafocale – Fig 5B. Picture extrafocal
Now consider the intra and extra images of figure 5
• Central location of the images : In intra there is an excess of intensity (noted +) and extras there is a defect (noted -) because the central rays converge closer to the intra picture (see figure 3).
• Marginal Zone image : In intra there is a defect intensity (noticed the sign -) while in extra there is excess (noticed the sign +) because the marginal rays converge closer to the image Extra (see figure 3).
When it carries out the subtraction of the two images S, you get the following results:
• Central Zone : An excess of intensity as (+) – (-) = (+)
• marginal zone : A defect in intensity as (-) – (+) = (-)
This in fact is what we observe on the Laplacian image wavefront (figura 4B).
The wavefront is related Laplacian operator, S to the signal obtained by subtracting the two intra and extra images .
(What we have seen so far here is a simple illustration to fix ideas, that is, not under any circumstances a demonstration !)
3. A practical example
Once we've taken steps to rebuild the wavefront, can be traced back to the values of the main decomposing aberrations that same wavefront Zernike polynomials.
These polynomials are defined mathematical functions on a disc, which can be linked to major aberrations.
For example, the image of figure 4 is the representation of the Zernike polynomial is linked to the spherical aberration (read more details on Zernike polynomials). Adding more polynomials, you can reconstruct a wavefront aberration as much affected by. Inversely, a measured wavefront can be adjusted to different polynomials, in order to trace the aberrations.
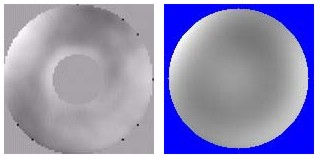
As an example we reproduce here an extract of the analysis of a Schmidt-Cassegrain trade (good quality). 5A is the image of the wavefront reconstructed from EF computer program from two images intra et extra focal.
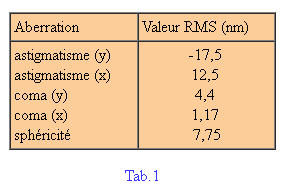
The following table 1 It shows the RMS values of some aberration, and Figure 5B is the image of the wavefront reconstructed using the values of the aberrations and the 22 first Zernike polynomials. The utilization of these 22 polynomials allows you to find the main aberrations and rebuild the general shape of the wavefront.

Fig.5A: Wavefront calculated with the EF Program starting from one intrafocal image and one
extrafocale.
Fig.5B: Wavefront rebuilt from 22 polynomials are Zernike, using rms values
of aberrations provided by the EF program.
The chart 1 is an excerpt of these 22 values. (The unit of measurement is the nanometer).
(NOTE: Interesting further explanations and finding updated software on the web by searching: “Project WinRoddier” your Astrosurf – and discussion “Optic testing (Roddier)” sul forum Cloudy night).

